Your basket is currently empty!
ProMap® T Cell Proliferation Assays
ProMap® naïve CFSE T cell proliferation assays
the gold standard for mapping naïve T cell responses
ProImmune’s ProMap® T cell proliferation assay can be used to identify epitope sequences that elicit helper T cell proliferation and therefore potentially cause a helper T cell immune response.
Unlike traditional assays which are based on radioactive thymidine incorporation, this assay utilizes powerful flow cytometry methods, enabling accurate determination of the percentage of proliferating cells and detailed phenotyping of T cell responses, all with significantly improved overall sensitivity.
Why choose ProMap® CFSE proliferation assays?CFSE dye dilution is a tried and tested method referenced in thousands of publications Much more sensitive than radioactive assays Flow cytometric readout resolves the correct cell populations to be analysed, such as live CD4+ T cells Further sub-set phenotyping is easy to add and proliferation of sub-sets can be read out simultaneously Integral assay measures all proliferation over proliferation timeframe and not over a time window at the end of the incubation time |
Key publication:
Validating antibody humanization with ProMap® T cell assays published by [dstl], part of the UK Ministry of Defence (MoD)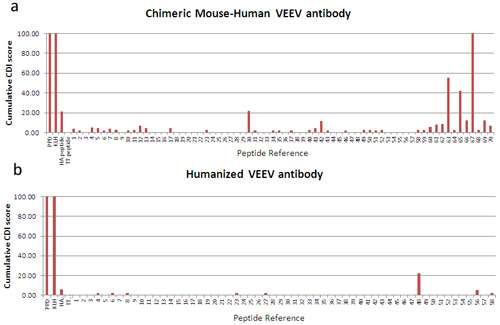
Figure 1 comparing overlapping peptide T cell responses in murine and humanized V-regions of an antibody.
O’Brien LM, Goodchild SA, Phillpotts RJ, Perkins SD.
Virology (2012) 426(2):100-5.[PMID:22341308]
Scientists at the UK Governmental Defence Science and Technology Laboratory [dstl] used ProImmune’s T cell proliferation assay to validate their humanization of an anti-Venezuelan Equine Encephalitis Virus (VEEV) antibody. Sequence humanization is a rational design approach of replacing animal protein sequence with human protein sequence in an antibody. However, this approach does not guarantee that a resulting biologic will have low immunogenicity. By using sequence scanning in vitro T cell assays, antigenicity data can be generated to show differences between the chimeric and humanized sequences. Read the full case study here.
ProMap® T cell assays and peptide/protein therapies
The ProMap® T cell proliferation assay has been developed to identify the presence or absence of potential T cell epitopes and is useful in preclinical discovery of novel peptides or proteins. The assays can address issues of ‘relative immunogenicity’ between structurally similar molecules; for example, they can help to distinguish between different candidates, or can give an indication of the success of protein engineering strategies in deimmunization of a potential immunotherapeutic.
As part of ProImmune’s REVEAL® Immunogenicity System, results from the ProMap® T cell proliferation assay can be analyzed alongside the outcome from cell-free HLA-peptide binding assays for more than 50 class II HLA alleles. This gives the customer a detailed profile of the helper T cell immune response to one or more drug leads.
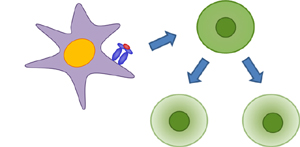
| Figure 2: ProMap® T cell Proliferation Assay Principle.
|
 |
In this short clip from our Mastering Immunity 2020 Conference, Dr. Tim Hickling (Head of Immunosafety, Roche) describes how the use of the ProMap® T cell proliferation assay has been applied in the deimmunization of biotherapeutics.
The full length presentation can be viewed here:
ProMap® T Cell Proliferation Assays in Detail
Cells are labeled with the fluorescent dye 5,6-carboxyfluorescein diacetate succinimidyl ester (CFSE). Those cells that proliferate in response to antigen show a reduction in CFSE fluorescence intensity, which is measured directly by flow cytometry. Since this is a flow cytometric assay, it accurately determines the percentage of proliferating CD4+ cells, enables detailed phenotyping of T cell responses, and is more sensitive than traditional assays based on radioactive thymidine incorporation.
ProImmune offers two types of T cell proliferation assay:
- ProMap® naive T cell proliferation assay for peptide epitope mapping (see below)
- ProScern® DC-T cell proliferation assay for whole protein screening
ProMap® T cell Assay for Peptide Epitope Mapping
This assay is used to identify peptide epitope sequences that can elicit helper CD4+ T cell proliferation and therefore potentially cause a helper T cell immune response that may lead to anti-drug antibody (ADA) responses or other unwanted immunogenicity. The assay can also be used to assess protein sequences for beneficial immunogenicity, for example in epitope discovery for immunotherapy.
Where the assay is intended to focus on CD4+ helper T cell responses, CD8+ T cell-depleted and CFSE-labeled donor PBMC are cultured with 5uM of each peptide of interest for 7 days in six replicate wells. Each assay plate includes a set of untreated control wells. The assay also incorporates reference antigen controls, comprising synthetic peptides for known MHC class II antigens, and two potent whole protein antigens.
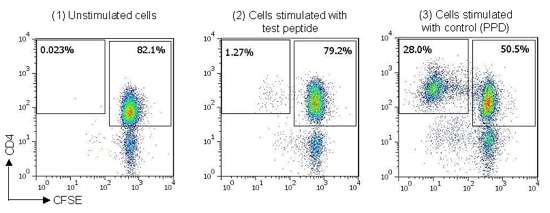
Figure 3: Example staining data from naïve T cell assay, (1) CFSE-labeled T cells cultured in media alone (unstimulated), (2) CFSE-labeled T cells cultured with peptide derived from antigen of interest, (3) CFSE-labeled T cells cultured with control protein (Tuberculin PPD).
Cell proliferation is determined by flow cytometric analysis. For ProMap® T cell assays, Percentage Stimulation above background is determined for each stimulated sample, through comparison with results from an unstimulated sample. Counts for the CD4+ CFSE dim population in each sample are expressed as a proportion of the total CD4+ population. The six replicate values are used to calculate Percentage Stimulation above Background (proportion of CD4+ CFSE dim cells with antigen stimulation, minus proportion of CD4+ CFSE dim cells without antigen stimulation).
The mean and standard error of the mean are calculated from the sextuplicate values. A result is considered “positive” if the Percentage Stimulation above background is greater than 0.5% and also greater than 2x standard error above background , though data are also presented with less stringent thresholds applied to allow small responses to be considered.
To allow for comparison of peptides, a Response Index is calculated. This index is based on multiplying the magnitude of response (Percentage Stimulation above background) for each peptide by the number of responding donors (Percentage Antigenicity) for each peptide.
Data presented in the report are:
- Percentage Antigenicity (the proportion of the donor cohort responding to a test peptide)
- Response Index
- Significance of responses, by one-way ANOVA with a threshold of p ≤ 0.05
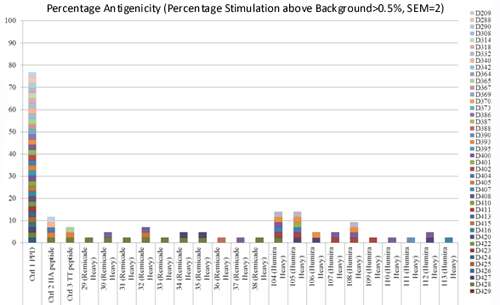
Figure 4: Percentage Antigenicity measured using ProMap® T cell Proliferation Assay: A cohort of 43 donors were used to test the potential immunogenicity of peptides from the the heavy chain regions of two therapeutic monoclonal antibodies, Remicade and Humira. Each donor is represented by a different colour. Peptides eliciting responses from 2 or more donors are considered worthy of further investigation.
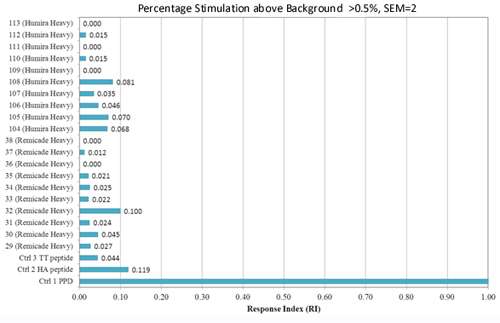
Figure 5: Response Indices from the ProMap® T cell Proliferation Assay: Data from the same assay as figure 3 – Response Indices give an indication of the magnitude, as well as the number, of responses to test peptides. Note that the response for PPD falls off the scale of this graph.
For a list of key ProMap® T cell Proliferation Assay citations, please click here.
